Real-Time Observability for Multi-Agent Workflows with OpenTelemetry
How Aegis provides runtime policy enforcement and OpenTelemetry spans to secure multi-agent AI workflows.
Aegis: Real-time Observability for Multi-Agent Workflows with OpenTelemetry
Enterprises adopting multi-agent AI need more than IAM and ad-hoc logs: they need runtime policy enforcement, auditable traces, and low-latency decisions that tie agent choices to approvals and tool calls. This article explains an OpenTelemetry-native telemetry model for agent observability, span design and semantic conventions, dashboards and alerting patterns, and a concrete incident-response playbook — with Aegis presented as the operational solution that implements these ideas. Content draws from the Aegis product brief and MVP spec.

Agent observability telemetry model
Multi-agent systems produce complex call chains: orchestrator → planner agent → specialist agent → tool call. Troubleshooting requires traces that link agent decisions, policy evaluations, approvals and downstream tool calls.
Why OpenTelemetry? OpenTelemetry is the de-facto standard for cross-system telemetry (traces, metrics, logs) and is actively evolving semantic conventions for GenAI and agent interactions. Many cloud-native teams report broad OpenTelemetry adoption across services, and the project continues to stabilise signals and conventions. (OpenTelemetry)
Key telemetry requirements for agents
- A span for every agent decision, including attributes: agent_id, agent_role, policy_version, decision, decision_reason, estimated_cost, parent_agent_id, approval_id.
- Spans for tool calls that include the tool_name, endpoint, params_hash (or redacted param summary), egress_destination, and response_status.
- An approval span when human intervention is required: approval_channel, approval_user, approval_latency, override_token_id.
- Cost metadata aggregated into metrics (cost_per_agent, cost_per-tool) for FinOps dashboards.
How Aegis implements this model
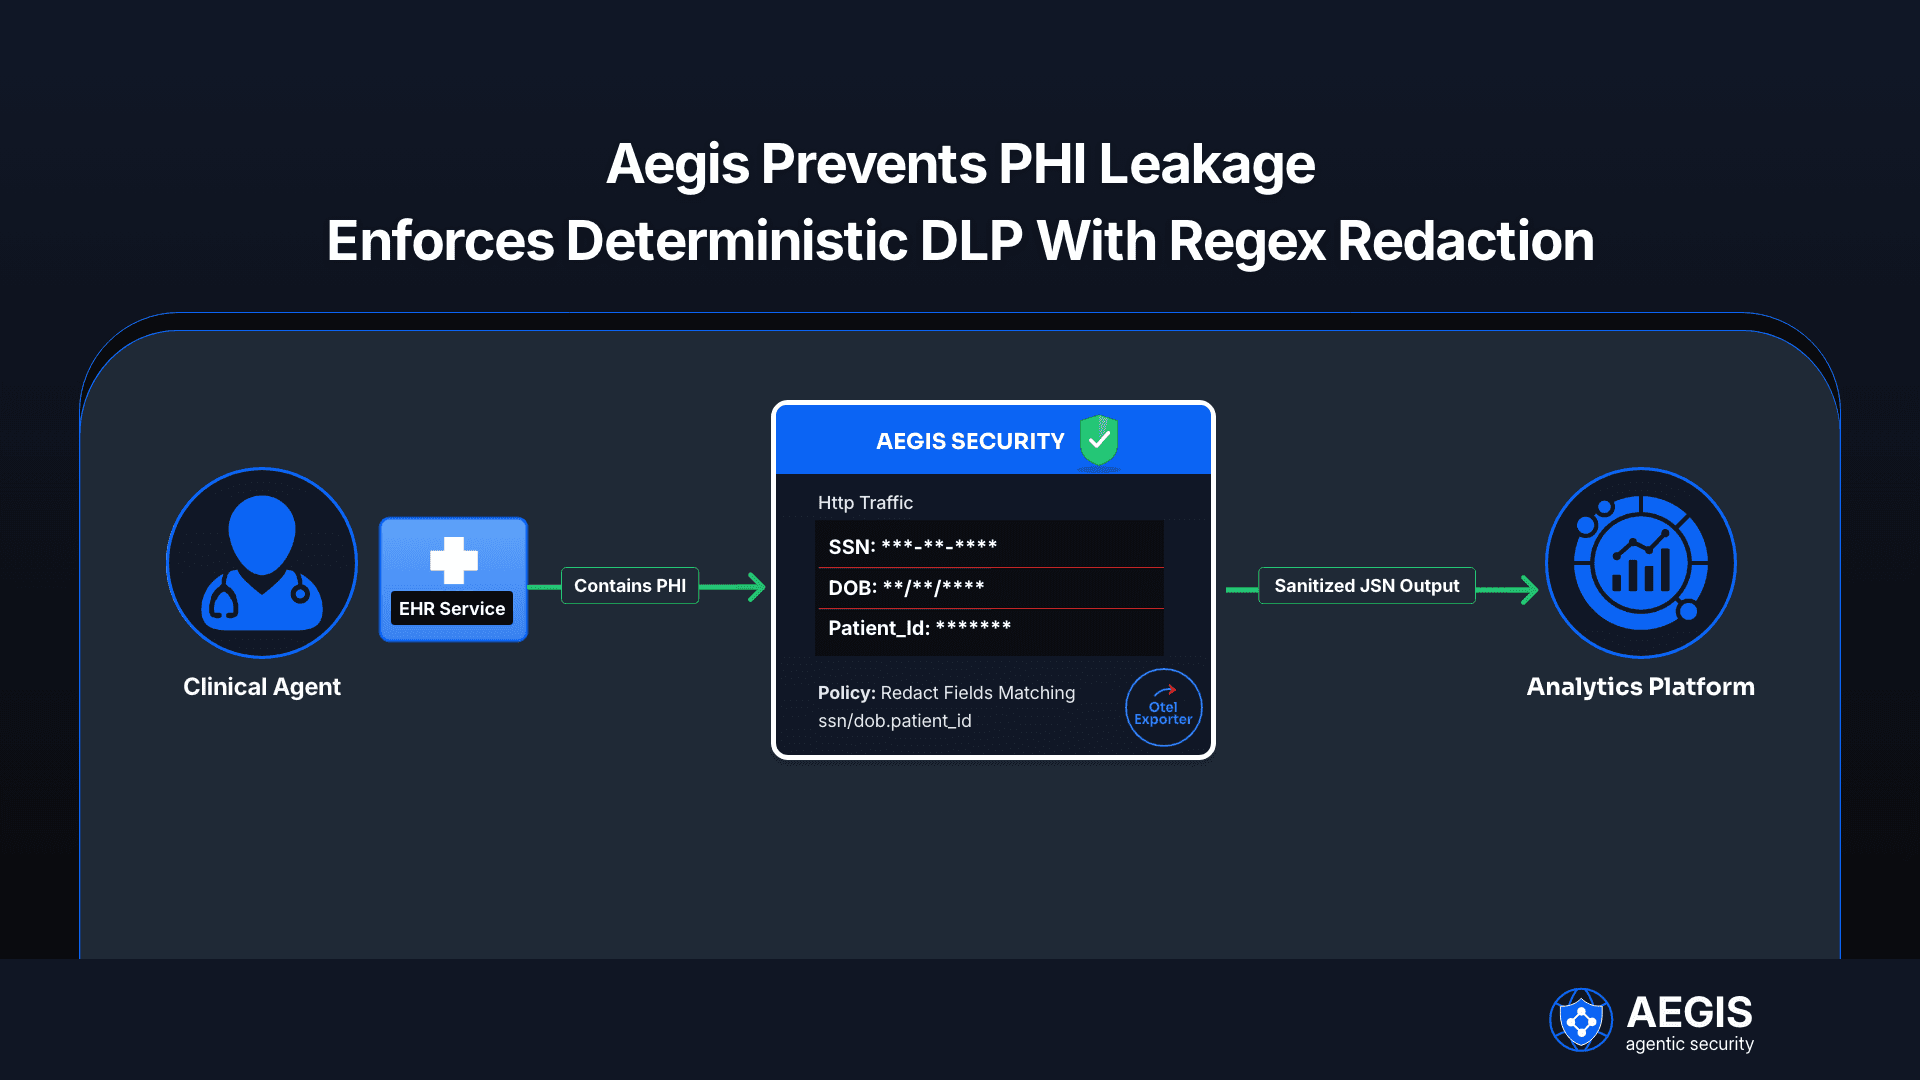
Aegis emits OTel spans for every policy decision and tool call, enriching them with agent-centric attributes so traces tell the complete story of who asked what, why it was allowed or blocked, and whether a human approved an override. This structured telemetry enables root-cause for unauthorized actions, chargeback grouping for FinOps, and SIEM alerting for would-be exfiltration flows.
👉🏻 Track critical metrics to proactively detect and resolve agent issues

Span design and semantic conventions
Design spans with consistent names and attributes so tracing back across orchestrators and agents is trivial.
Recommended span types and attributes
- orchestrator.decision — attributes: orchestrator_id, workflow_id, trace.initiator.
- aegis.policy_evaluation — attributes: agent_id, policy_id, policy_version, decision (allow|deny|sanitize|approval_needed), decision_reason, latency_ms.
- aegis.approval — attributes: approval_id, approver, channel, outcome.
- tool.call — attributes: tool_name, tool_type, tool_action, status_code, response_time_ms, egress_destination.
Semantic conventions: use lowercase snake_case keys and a small fixed vocabulary for decision and tool_type. Include redaction_level when payloads are sanitized. When spanning parent/child relationships, always propagate parent_agent_id and agent_chain arrays for easy provenance.
Practical examples (attributes snippet)
- aegis.policy_evaluation → { "agent_id":"finance-agent-23", "policy_version":"v2.4", "decision":"deny", "decision_reason":"max_amount_exceeded", "amount":50000 }
- tool.call → { "tool_name":"stripe-payments", "tool_action":"create_payment", "estimated_cost_usd":0.02 }
Span design in Aegis: Aegis compiles policies and emits the aegis.policy_evaluation span for every intercepted call; when an action is blocked it returns a PolicyViolation error payload and a signed audit token for the event.
👉🏻 Enhance debugging with deep visibility into agent execution paths
Dashboards and alerts (Grafana / SIEM examples)
Dashboard building blocks
- Traffic: calls/sec per agent and per tool.
- Decision ratios: allow/deny/sanitize/approval_needed over time.
- Latency: p50/p95/p99 for policy decisions (target ≤ 20 ms P99).
- Cost: rolling 24-hour cost per agent and per tool (FinOps view).
- Shadow mode: would-block counts to validate policy changes before enforcement.

SIEM alerts and SOC playbooks
Integrate Aegis' structured logs and OTel spans into SIEM (Splunk/ELK/Datadog) and alert on patterns such as:
- Rapidly rising approval_needed rates for a single agent (possible compromise).
- Attempts to egress to unknown domains (exfiltration).
- Parent/child chain anomalies where parent_agent_id is absent but a high-privileged tool call occurs.
Aegis can forward JSON logs and OTLP to SIEMs and attaches policy_version and approval_id to alerts to provide SOC analysts immediate context.
👉🏻 Accelerate incident response with intelligent, automated agents
Incident response playbook with traces
When an incident occurs (e.g., unauthorized payment attempt), traces let you answer the core forensic questions quickly: which agent initiated it, which policy permitted or blocked it, which approval (if any) occurred, and which downstream tool endpoint was contacted.
Suggested playbook steps
- Query the trace for aegis.policy_evaluation spans with decision=deny or unusual decision_reason.
- Open the span timeline: identify orchestrator.decision and tool.call siblings to reconstruct the chain.
- Enrich with logs: pull the signed audit token and policy_version from the span attributes; correlate with policy history and approval records.
- Execute containment: revoke the offending agent token, quarantine agent identity, and block the implicated egress domain.
- Remediate: rotate keys, update policy to block the specific pattern, and run a shadow mode validation to ensure no collateral impact.
Aegis supports signed audit tokens and an approvals service that records approval events (channel, approver, override token) and links them into traces, shortening SOC triage time.
Telemetry vs enforcement (operational comparison)
Concern | Telemetry (OTel spans) | Runtime Enforcement (Aegis) |
Visibility | Trace of decision + tool call | Real-time allow/deny/sanitize decisions. |
Actionability | Forensics, dashboards, FinOps | Immediate enforcement, approvals, overrides. |
Auditing | Signed spans + metadata | Tamper-resistant logs + policy versioning. |
Integration | OTLP to Grafana/Tracing backends | Envoy ext_authz / SDKs for orchestrators. |
Policy sampling table: example policies and outcomes
Policy Example | Condition | Outcome (Aegis) |
finance-payments.max_amount=5000 | amount <= 5000 | allow |
finance-payments.max_amount=5000 | amount > 5000 | approval_needed → pause |
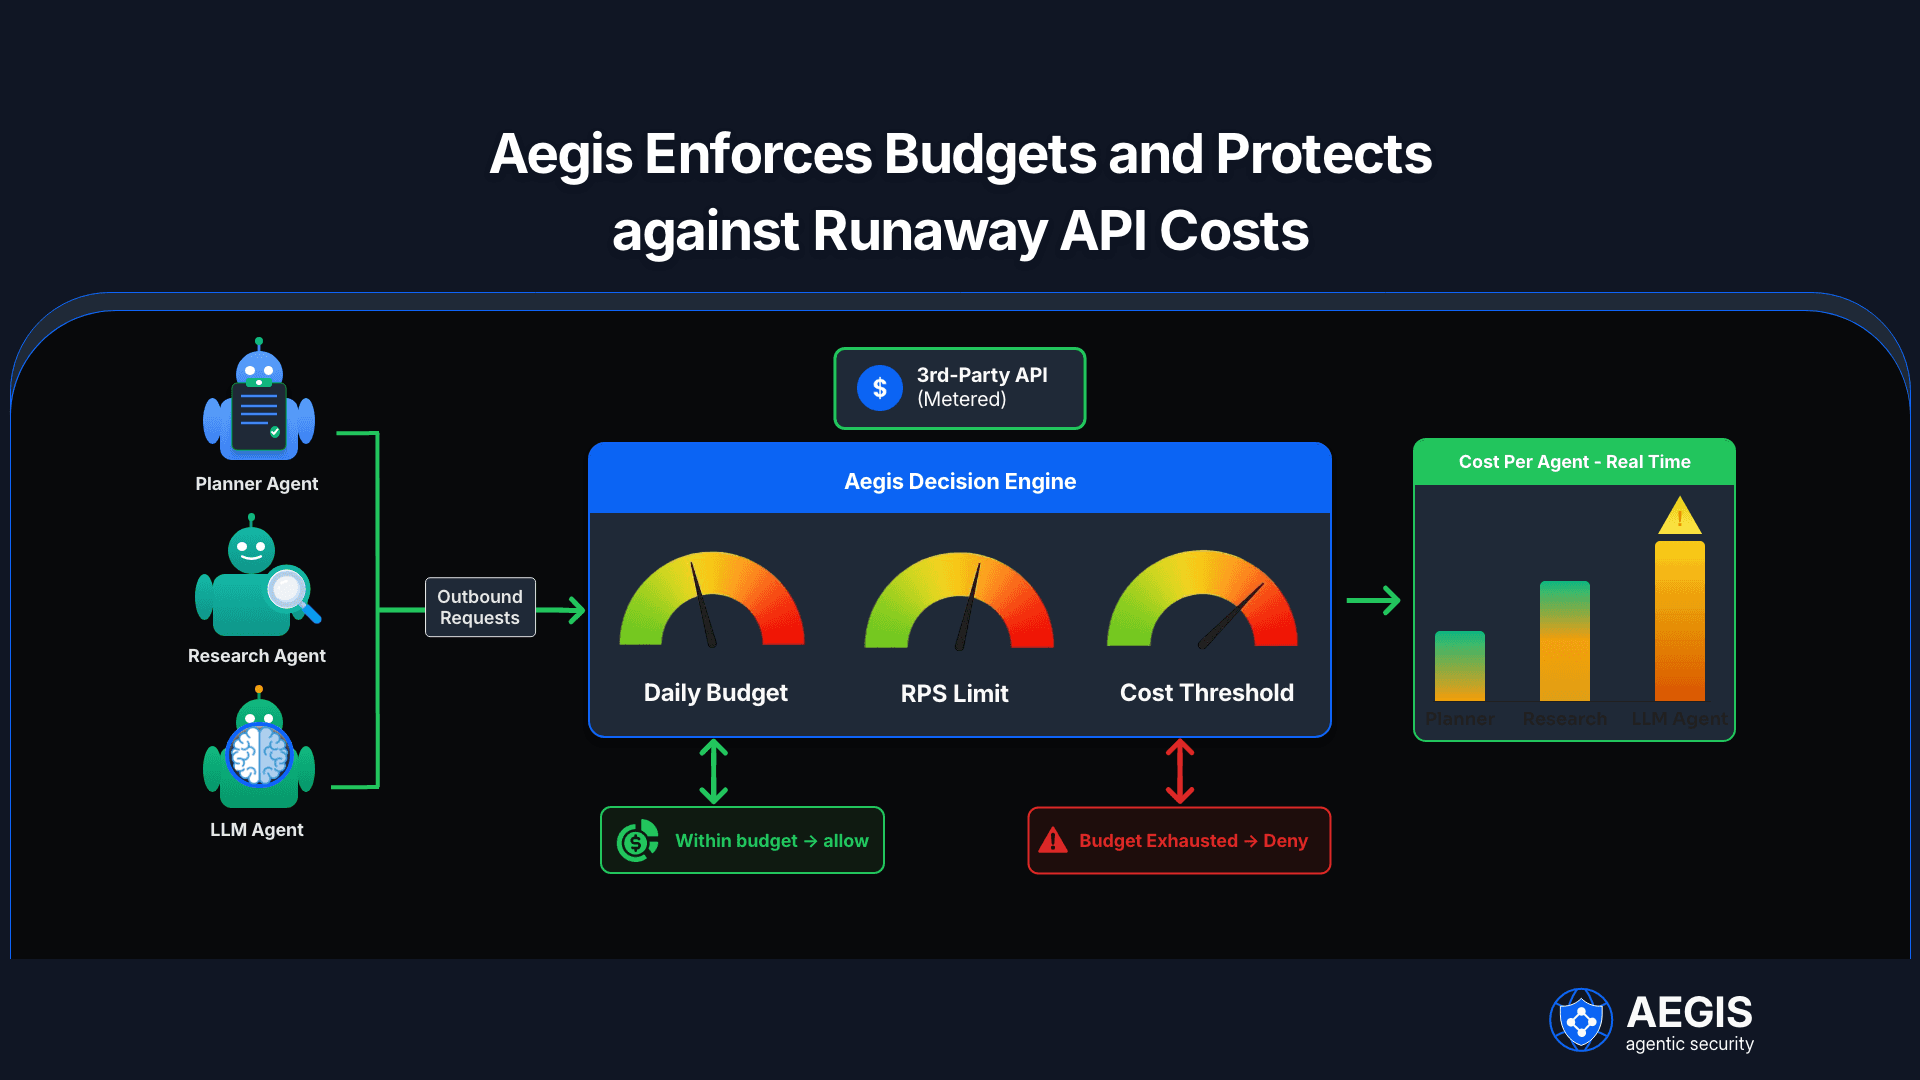
llm-agent.daily_budget=20usd | budget_exhausted | deny (BudgetExceeded) |
support-agent.post_channel=/#support | out_of_hours & channel != #support | sanitize / deny |
aegis
Why this matters: market & adoption context
Agentic AI adoption is accelerating but maturity remains uneven. Recent industry reports show only a small share of organizations have fully scaled agentic AI while many are piloting or exploring—this creates a window where security, policy and observability matter most. For example, several industry surveys report that roughly 23% of organizations are scaling agentic systems and many more are experimenting, while only a small portion have reached high maturity. (McKinsey & Company)
OpenTelemetry is becoming the standard telemetry fabric for cloud-native and agentic observability; the project continues to stabilise conventions and is widely used across organizations for traces and metrics, making it the logical choice for agent observability. (OpenTelemetry)
How Aegis fits
Aegis is a runtime policy and observability fabric for multi-agent AI systems that combines policy-as-code, low-latency enforcement, and OpenTelemetry-first telemetry. It sits between orchestrators and downstream tools (proxy/sidecar or SDK middleware), evaluates compiled policies (OPA bundles), and emits detailed OTel spans for every decision and tool call. This design provides three operational benefits:
- Security & governance — enforce least privilege per agent, validate parameters, and require human approval for high-risk actions (payments, egress, production deploys).
- Auditability & compliance — signed spans, versioned policies and approval records create a tamper-resistant trail for SOC and auditors.
- Operational control & FinOps — per-agent budgets, cost metadata in spans, and dashboards let finance and platform teams attribute spend and throttle runaway usage.
Aegis supports shadow mode for safe rollouts, hot-reloaded bundles for minimal disruption, and developer-friendly CLI/SDKs for LangChain/LangGraph integrations. Deployments can be sidecar/proxy-based (Envoy ext_authz) or as middleware for non-HTTP tools; decision latency is optimised using prepared OPA queries and in-memory caches (P99 target under ~20 ms).
Implementation checklist (operational steps)
- Instrument orchestrator and agents to propagate traceparent and parent_agent_id.
- Deploy Aegis sidecar/forward proxy (Envoy ext_authz) or use SDK middleware.
- Write policy YAMLs and run in shadow mode for 7 days; collect would_block counts.
- Promote to enforce; configure approval channels and override tokens
- Feed OTLP to tracing backend and build Grafana dashboards: decisions, latency, cost.
- Integrate logs/spans with SIEM for SOC use cases and set runbooks for alerts.
Frequently Asked Questions
Q: What span attributes are essential for audits?
A: agent_id, policy_version, decision, decision_reason, approval_id and estimated_cost are minimal for meaningful audit trails.
Q: How does Aegis avoid adding latency?
A: Use prepared OPA queries, in-memory caches, optional WASM evaluation, and compact policy bundles; target P99 ≤ 20 ms for decision calls.
Q: Can Aegis handle non-HTTP tools?
A: Yes — SDK middleware and decorator patterns allow non-HTTP integrations; sidecars handle HTTP and re-origination for deep inspection.
Q: How do we run policies safely in production?
A: Deploy in shadow mode to gather would-block metrics, tune policies, then switch to enforcement. Use dry-run tools and versioned rollbacks.
Q: What FinOps capabilities are included?
A: Per-agent budgets, estimated cost metadata on spans, throttles, and dashboards for chargeback and budget alerts .
Closing notes
Observability and enforcement are complementary: traces let you understand and prove what happened; runtime enforcement prevents the bad action in the first place. For enterprises piloting agentic AI, combining OpenTelemetry-native spans with a runtime policy mesh such as Aegis provides a pragmatic path to secure, auditable, and cost-controlled multi-agent deployments.