Adding Observability to Agentic AI with Distributed Tracing
Add end-to-end OpenTelemetry tracing to agentic AI for latency, compliance, and FinOps — practical guide with Aegis examples.

Adding Observability to Agentic AI: Traces, Latency, and Auditable Decisions
Agentic AI systems spawn short-lived agents, chained workflows, and tool calls that cross process, network, and trust boundaries. Without a standardized trace contract, security engineers and SOC teams lack reliable end-to-end evidence tying intent → agent → tool call → response. This gap undermines latency debugging, root-cause analysis, compliance proofs, and FinOps attribution. Recent enterprise surveys show 23% of organizations are already scaling agentic AI and another 39% are experimenting — so the problem is urgent and operational. (McKinsey & Company)
This article explains a practical, standards-aligned approach: treat agentic workflows as distributed applications, propagate trace context across agent-to-agent and agent-to-tool boundaries using OpenTelemetry conventions, and capture structured spans for policy decisions, approvals, and tool calls. About one third of this post describes Aegis — a runtime policy + observability gateway designed to emit auditable OpenTelemetry spans, enforce policies, and provide SOC/FinOps evidence.
Why distributed tracing for agents matters
Agentic systems create three core observability problems:
- Fragmented context: agents spawn other agents; ad-hoc logs live in separate silos and cannot reliably reconstruct causal chains.
- Latency hotspots: planners trigger chains that amplify retries and third-party connector latency, creating high P95/P99 tails that are hard to attribute.
- Auditability gaps: regulators and auditors need tamper-resistant proof of which policy and which approver allowed or denied a high-risk action.
OpenTelemetry’s GenAI/agent semantic conventions are evolving to address these gaps; standardizing on OTel spans makes traces portable across observability stacks and SIEMs. (OpenTelemetry)
👉🏻 Unlock real-time insights across complex agent ecosystems

Design principles — the trace contract for agentic workflows
Adopt a minimal, mandatory trace contract propagated across every call:
- Standard trace headers: traceparent (W3C), plus parent-agent-id, agent-id, policy-version.
- Span types mapped to agent lifecycle: agent.creation, agent.planning, agent.execution, tool.call, policy.evaluation, approval.
- Structured span attributes: agent_id, tenant, policy_id, decision, decision_reason, cost_estimate_usd, approval_id.
- Failure modes: fail-closed propagation so trace headers survive retries, proxies, and circuit breakers.
Practical rule: emit full traces for high-risk actions (payments, EHR access), head samples for routine calls, and store signed span summaries for compliance. Use retention tiers (1 year for high-risk, 90 days routine) to balance compliance and cost.
👉🏻 Detect anomalies early with comprehensive observability tracking

Mapping agent lifecycle to spans
Map lifecycle events to span flow
Example span sequence for a payment flow
- agent.create — planner agent spawns finance agent (attributes: parent_agent_id, planner_intent_hash).
- agent.plan — finance agent composes a payment plan (amount_est, currency sanitized).
- policy.evaluation — policy engine evaluates rules (span records policy_version, decision=shadow|allow|deny|approval_needed).
- approval — if needed, approval span includes approval_id, approver metadata, and latency.
- tool.call — connector span (e.g., stripe.payments) with http.status, retries, backend_latency_ms.
- agent.complete — final agent span aggregates outcome and cost attribution.
Concrete JSON for a tool.call span (example):
{
"name":"tool.call",
"attributes":{
"agent_id":"finance-42",
"tool":"stripe",
"operation":"create_payment",
"decision":"allow",
"policy_version":"v2025-06-12",
"cost_estimate_usd":0.12
}
}
Aegis in practice — runtime policy + observability
About one third of this article focuses on Aegis as a solution. Aegis is a lightweight policy and telemetry fabric that sits between orchestrators (LangGraph, AgentKit, custom) and tools. It enforces per-agent identity and policy, inspects parameters, and emits OTel spans for every decision. Key behaviors:
- Sidecar/proxy model intercepts tool calls and calls an external authorization service (ext_authz pattern).
- Policy decisions: allow, deny, sanitize, approval_needed — each decision becomes an auditable span containing policy_version and decision_reason.
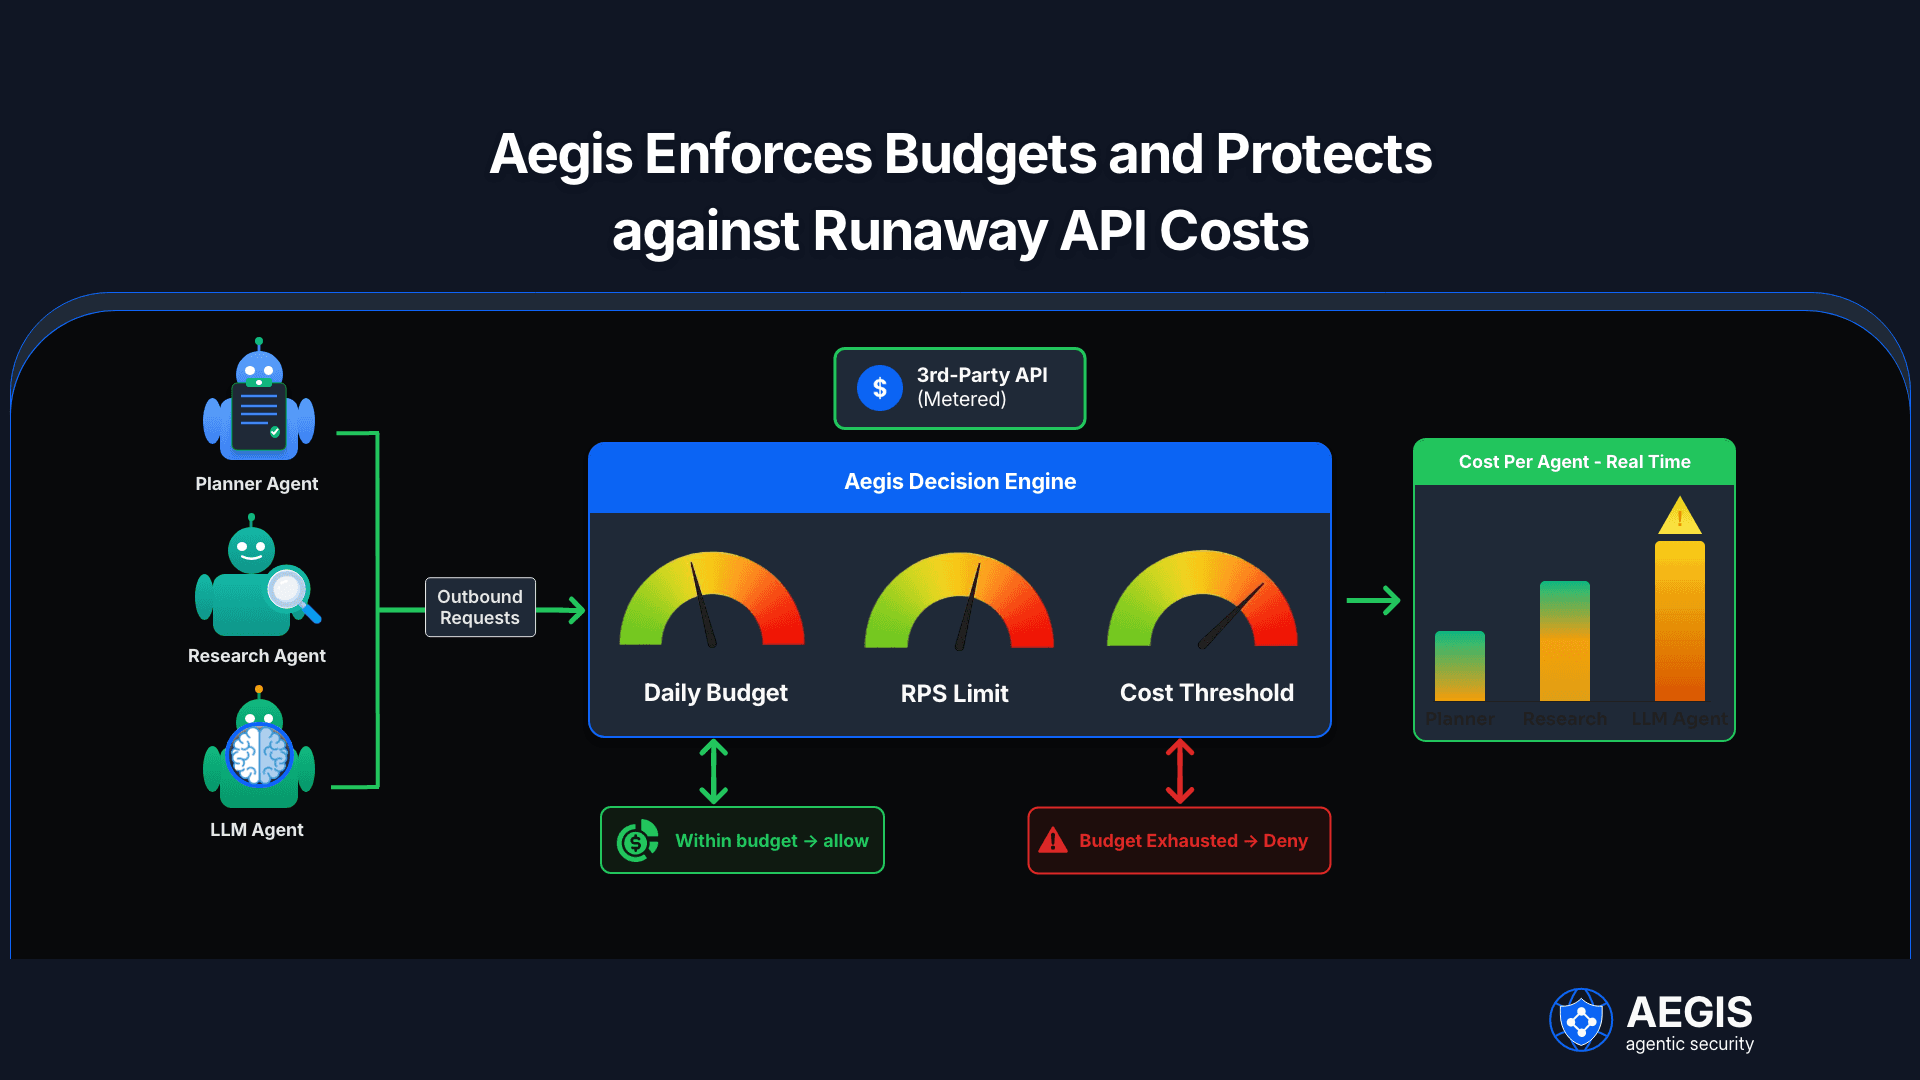
- FinOps attribution: Aegis tags spans with cost_center, cost_estimate_usd and correlates traces with billing metrics so cost spikes map to agent decision paths.
Example — payment flow root cause
A planner instructs a finance agent to run a payment batch. Tracing shows finance→stripe calls have repeated retries and a 95th-percentile latency caused by a third-party SDK timeout. Aegis emits spans showing retries=5 and backend_latency_p95=1800ms; the policy span shows decision=allow with policy_version and the approval span includes approval_id. The fix: tune connector timeouts and add a policy timeout to prevent downstream spirals.
👉🏻 Strengthen accountability with detailed and tamper-proof audit trails
Sampling, retention, and compliance tradeoffs
- Sample strategy: full traces for high-risk decisions (payments, PHI access), probabilistic head sampling for low-risk calls.
- Retention policy: signed span summaries retained per risk category (1 year for high-risk). Hash chains provide tamper evidence for auditors.
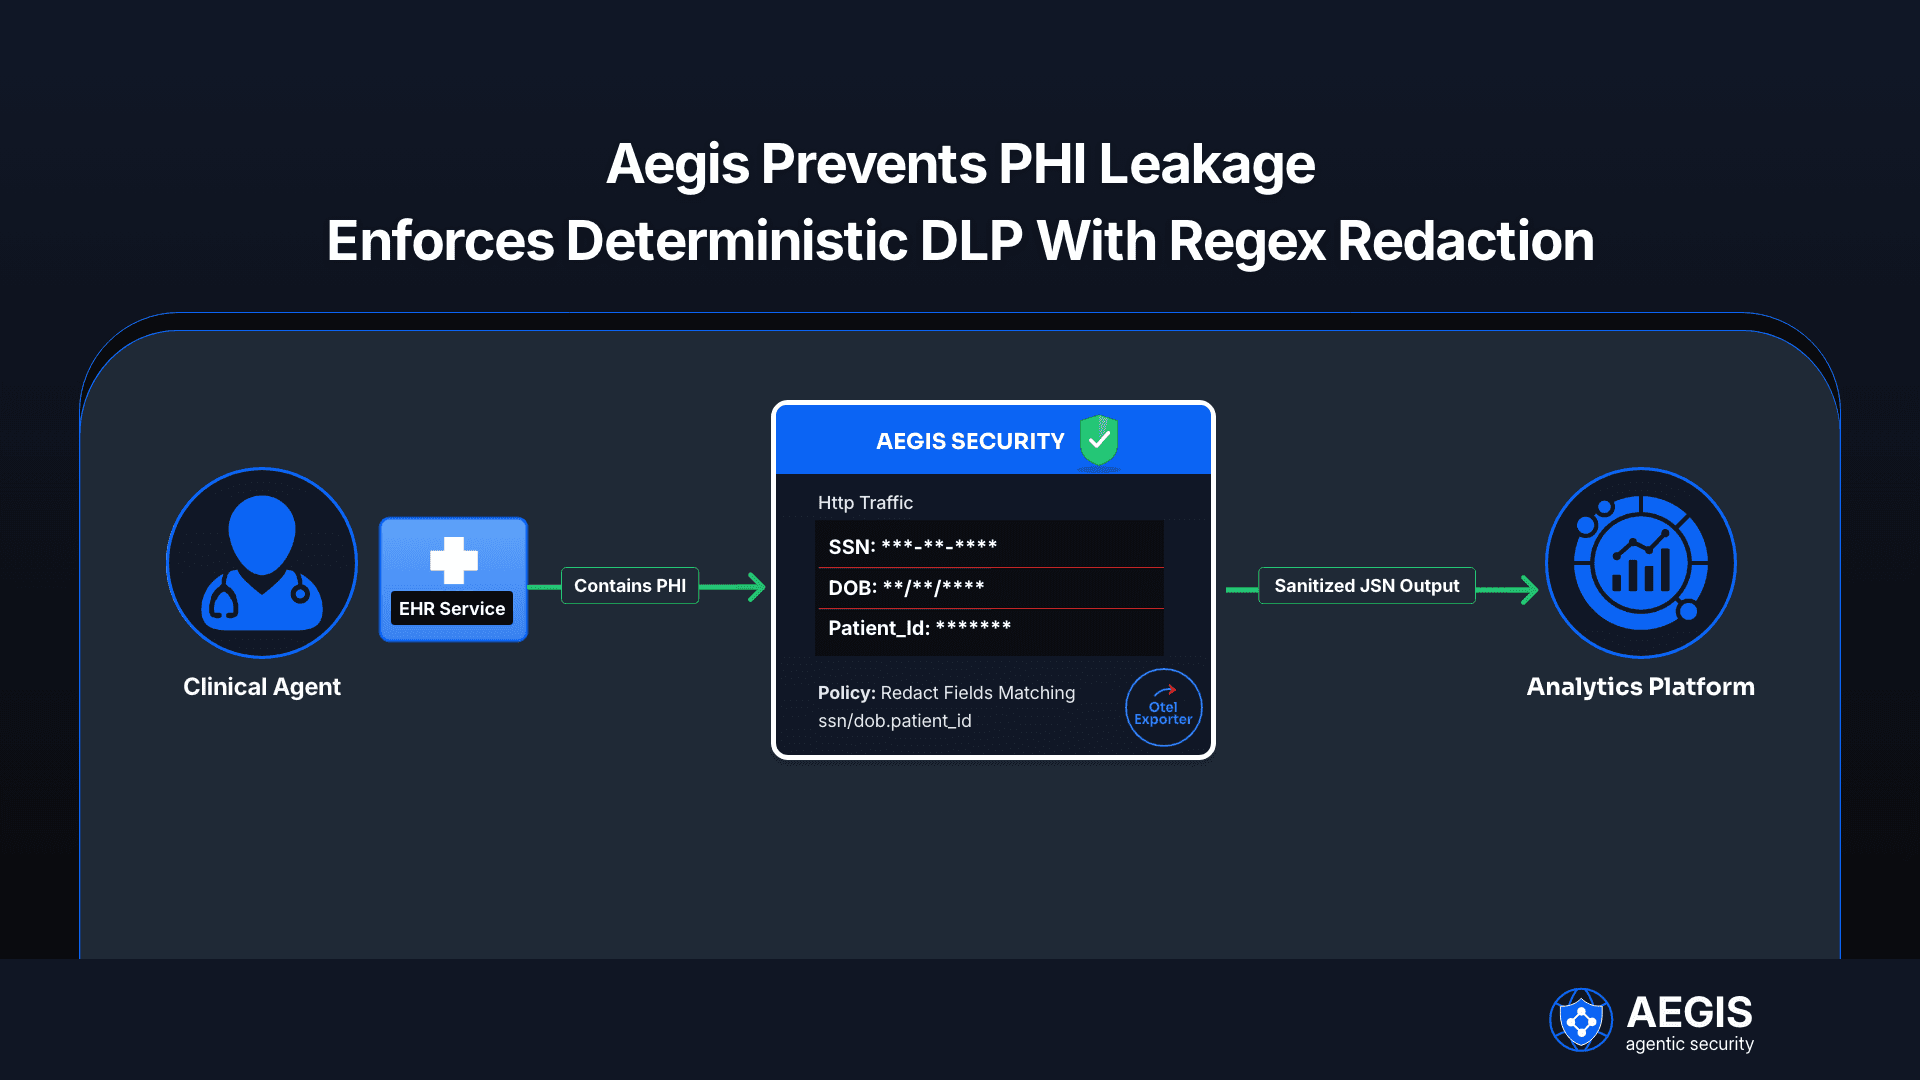
- Redaction: enforce PII obfuscation at span level before export; store mapping only when needed under strict access controls.
OpenTelemetry and community GenAI conventions provide guidance on attribute naming and stability opt-in to ensure compatibility across platforms. (OpenTelemetry)
Instrumentation checklist & onboarding
Quick checklist for ramping observability with an Aegis sidecar:
- Add trace propagation headers (traceparent, agent-id, parent-agent-id, policy-version) to agent SDKs.
- Instrument policy engine to emit policy.evaluation spans with decision_reason.
- Configure sampling rules: full for policy.decision==deny or approval_needed.
- Hook traces to SIEM (structured JSON) and FinOps (cost attribution pipeline).
- Deploy shadow mode for 7 days, tune rules, then flip to enforce.
Retention & attributes
Table 1 — Trace retention by risk
Risk category | Sampling policy | Retention |
High-risk (payments, PHI) | Full | 365 days (signed summaries) |
Medium-risk (config changes) | Head + conditional full on anomalies | 180 days |
Low-risk (chat, retrieval) | 1% head sample | 90 days |
Table 2 — Recommended OTel + custom attributes
Attribute | Type | Purpose |
agent_id | string | Identity of calling agent |
parent_agent_id | string | Causal parent agent |
policy_version | string | Version for auditor traceability |
decision | enum | allow/deny/approve/shadow |
cost_estimate_usd | float | Pre-call cost estimate |
approval_id | string | Human approval reference |
Dashboards, alerts, and incident replay
Build dashboards showing:
- Top latency tool calls (by P95/P99)
- Blocked actions and would-block ratios (shadow → enforce delta)
- Policy rollbacks and decision trends
- Cost by agent and anomalous spend spikes
Automate alerts for chained-agent anomalies (e.g., agent spawn spirals) and provide trace-based replay tools so SOC can reconstruct incidents step-by-step.
Best practices & operational SLAs
- Target P99 policy decision latency <20 ms; precompile queries and cache policy bundles to hit this target.
- Fail-closed for writes; configurable fail-open for reads.
- Use dry-run traces in shadow mode for validation without blocking production.
- Redact PII before export and maintain access controls for signed span archives.
Where to start (practical next steps)
- Standardize trace headers and add propagation to SDKs and orchestrator middleware.
- Deploy an enforcement sidecar (Aegis gateway pattern) in shadow mode and collect two weeks of would-block traces.
- Tune policies, set sampling rules, map traces to billing data, then flip critical policies to enforce.
Frequently Asked Questions
Q1: What attributes are mandatory for agent traces?
A1: At minimum include traceparent, agent_id, parent_agent_id, and policy_version. Add decision and decision_reason for policy spans.
Q2: How do we balance sampling vs. compliance retention?
A2: Sample aggressively for performance data, but keep full traces (or signed summaries) for high-risk actions for 1 year.
Q3: Can Aegis work with existing orchestrators like LangGraph?
A3: Yes — Aegis is designed as an orchestrator-agnostic gateway/sidecar with SDKs and middleware for common frameworks.
Q4: How do we prove to auditors that a policy prevented an action?
A4: Emit a signed policy.evaluation span containing policy_version, decision=deny, decision_reason, and store the signed summary in the audit archive.
Q5: What are recommended SLAs for trace availability?
A5: Traces should be available to SOC within ~30s of action; policy decision P99 latency target <20 ms.
Q6: Which community standards should we follow?
A6: Use OpenTelemetry semantic conventions for GenAI and follow the evolving GenAI observability guidance for attribute naming and stability opt-ins. (OpenTelemetry)
Closing
Instrumenting agentic AI with a standardized trace contract and runtime policy fabric gives security, compliance, and FinOps teams the missing causal evidence to operate at scale. Aegis combines policy-as-code, runtime enforcement, and OpenTelemetry-native telemetry to make intent auditable, latency actionable, and cost attributable — a pragmatic pathway for enterprises moving beyond experiments into safe, governed agentic AI.