
Performance Testing Multi-Agent Systems: Metrics and Tools
How to benchmark, test, and observe agentic AI systems — focusing on policy decision latency, synthetic workloads, and Aegis runtime enforcement.
Agent Performance Testing: Metrics, Patterns, Tools — and how Aegis tackles policy decision latency
Enterprises moving agentic AI into production need repeatable performance tests that cover not just HTTP latency but cross-agent orchestration, policy evaluation hot paths, and cost scenarios. This article provides an engineering-first playbook for metrics, synthetic workload patterns, tooling recommendations, and Aegis-specific test cases for measuring and controlling policy decision latency and overall agent performance.
Why agent performance testing is different
Agent ecosystems combine orchestration logic, chained tool calls, parameterized actions, and policy evaluation. Traditional endpoint load tests — single-request latency or RPS — miss three operational realities:
- Chained latency: a single user request creates a 3–6 agent call chain where P95 compounds.
- Policy hotspots: runtime policy evaluation (e.g., OPA/rego or WASM) can add CPU and latency under load.
- Cost and external dependencies: LLM calls or paid APIs can dominate latency and cost under synthetic stress.
Key metrics to track (minimum): throughput (RPS), success rate, error rate, P50/P95/P99 latency, policy decision latency, end-to-end task time, and resource metrics (CPU, memory, worker/goroutines). Traceability must link agent spans to tool calls — OpenTelemetry is the recommended standard for that correlation.
👉🏻 Improve system health with continuous monitoring and insights
Metrics: what to measure and why
Use the table below to prioritise measurable KPIs for agentic systems:
Metric | Why it matters | Target (example) |
End-to-end P95 task time | User-visible responsiveness for orchestration flows | < 500ms for common flows |
Policy decision P99 | Hot path for security and compliance checks | ≤ 20ms P99 (goal) |
Throughput (RPS concurrent orchestrations) | Capacity planning for orchestrator & gateway | support 1k concurrent chains baseline |
Success rate / error rate | Functional correctness under load | > 99.9% success |
CPU / memory / goroutines | Detect leaks, saturation | Steady state with <20% headroom |
Cost per orchestration | FinOps control when LLMs used | enforce budget limits per agent |
Collect decisions, reasons, policy_version, approval_id, and cost estimates as structured fields in spans and logs.
Test patterns and synthetic workloads
To emulate real-world agent behavior, tests should include:
- Chained calls: simulate 3-agent chains (planner → finance → payments) with parent_agent_id headers.
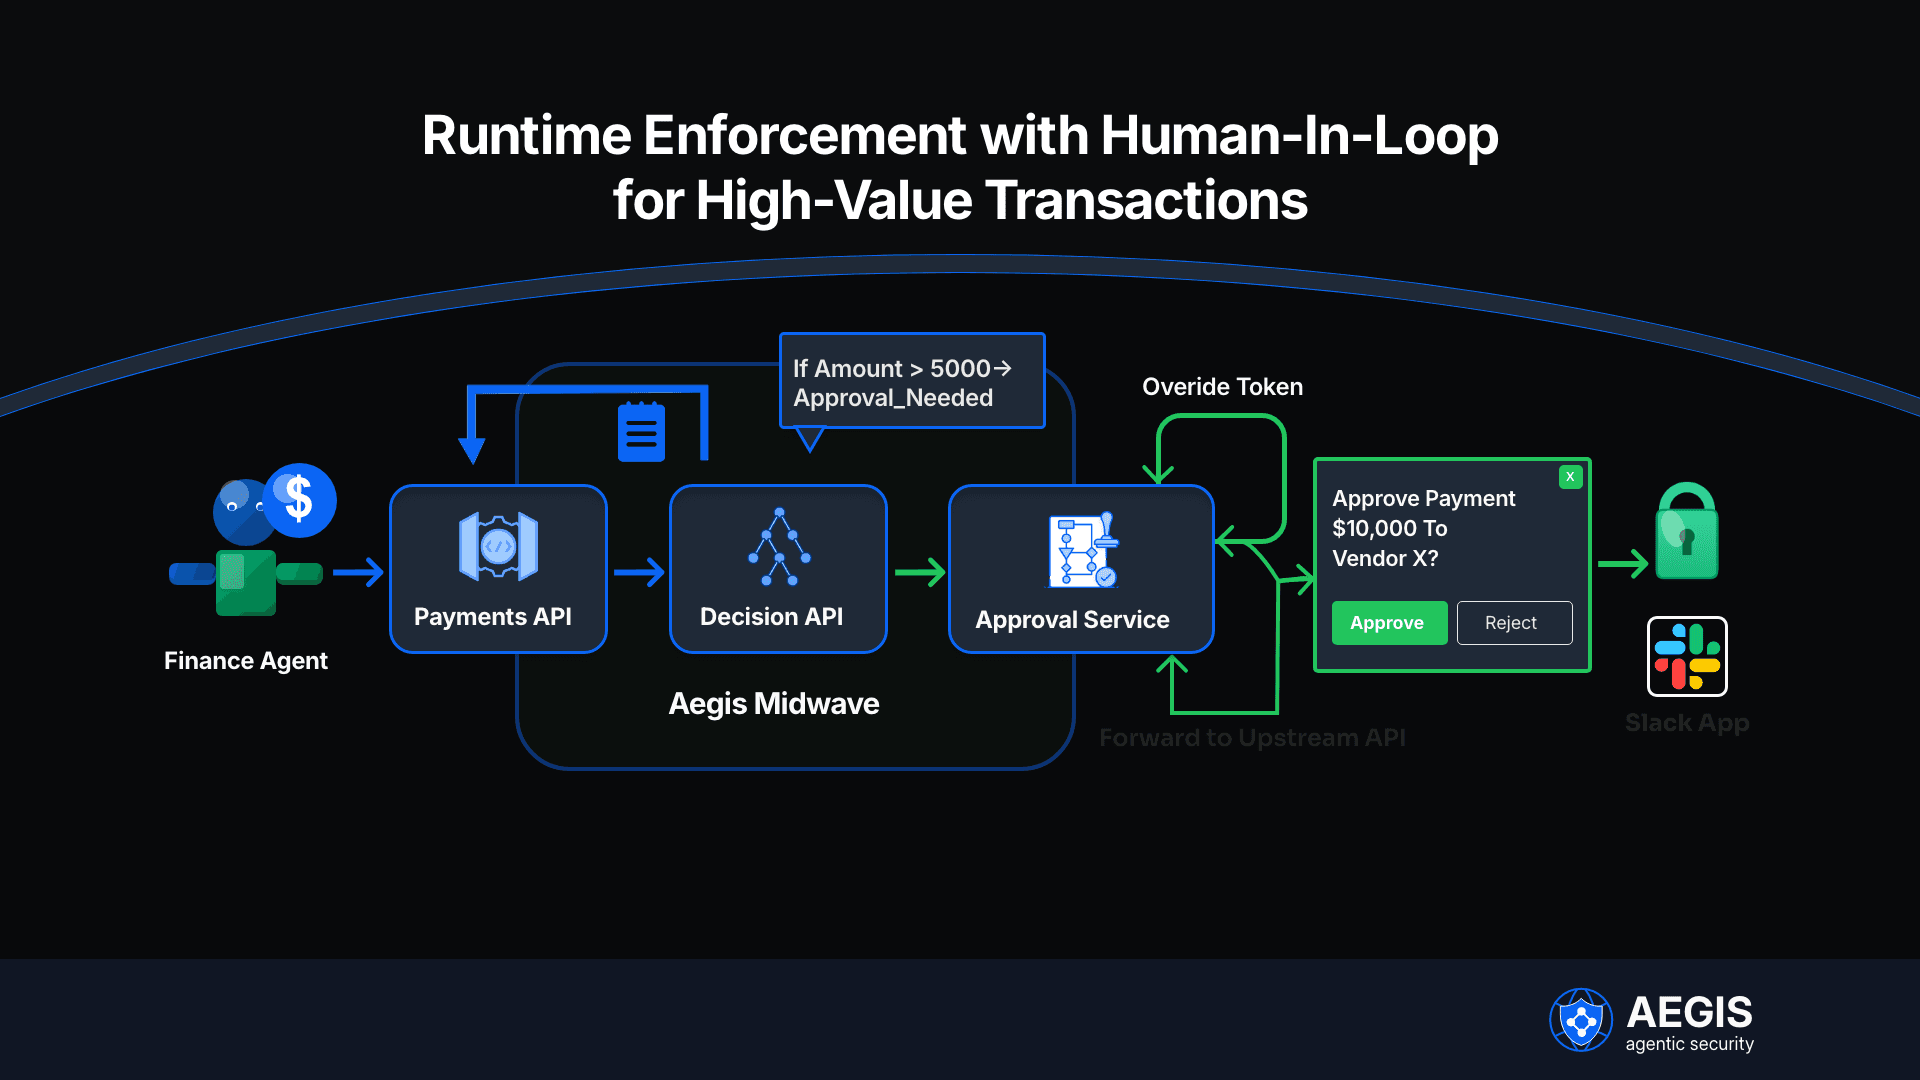
- Approval flows: inject approval_needed decisions that pause flows and exercise override token paths.
- Retry & backoff: simulate slow tools that trigger retries and exponential backoff.
- Policy cold/warm paths: measure policy eval with bundle cold cache (cold start) and warmed caches.
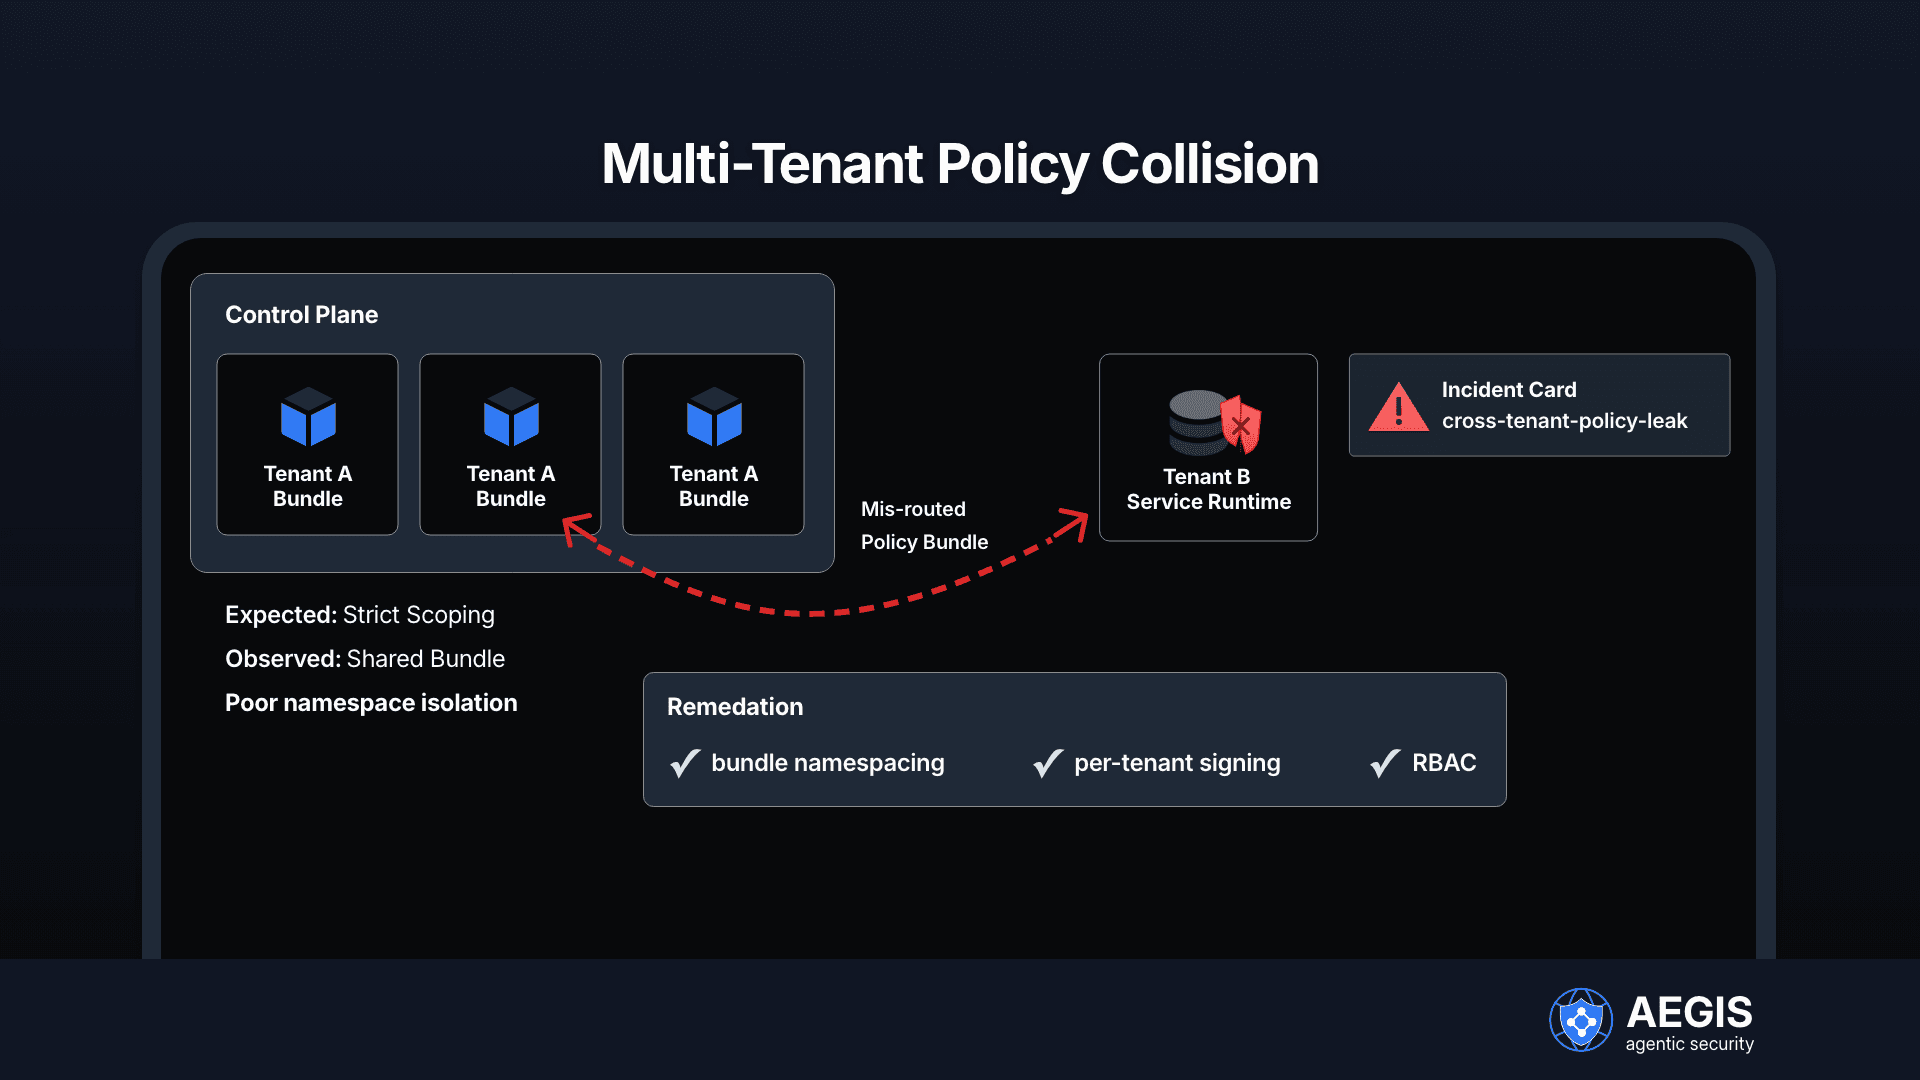
- Chaos scenarios: bring down approval service, simulate tool egress failures, and validate fail-closed / fail-open behavior.
- Cost storms: simulate many LLM calls to verify budget enforcement and throttling.
Load shaping: ramp, spike, soak. Ramp uncovers throttling, spike tests circuit breakers, soak detects memory leaks.
👉🏻 Measure what matters to benchmark and optimize agent performance
.png&w=3840&q=75)
Tools & observability stack
Practical toolset:
Purpose | Tools / approach |
HTTP load & scenario scripts | k6, Locust, JMeter, custom harness for orchestration flows |
Tracing & metrics | OpenTelemetry + Jaeger/Tempo + Prometheus + Grafana |
Policy eval profiling | OPA prepared queries, WASM profiling |
Chaos & fault injection | Ad-hoc scripts / chaos frameworks |
Cost simulation | Mock LLM endpoints to emulate variable latency & cost |
Correlate traces across agents and tools by propagating a root_trace_id and agent context headers. Instrument policy engine to emit spans for "policy.eval" with timing and decision metadata (policy_id, rule_id, reason).
Aegis-specific test cases
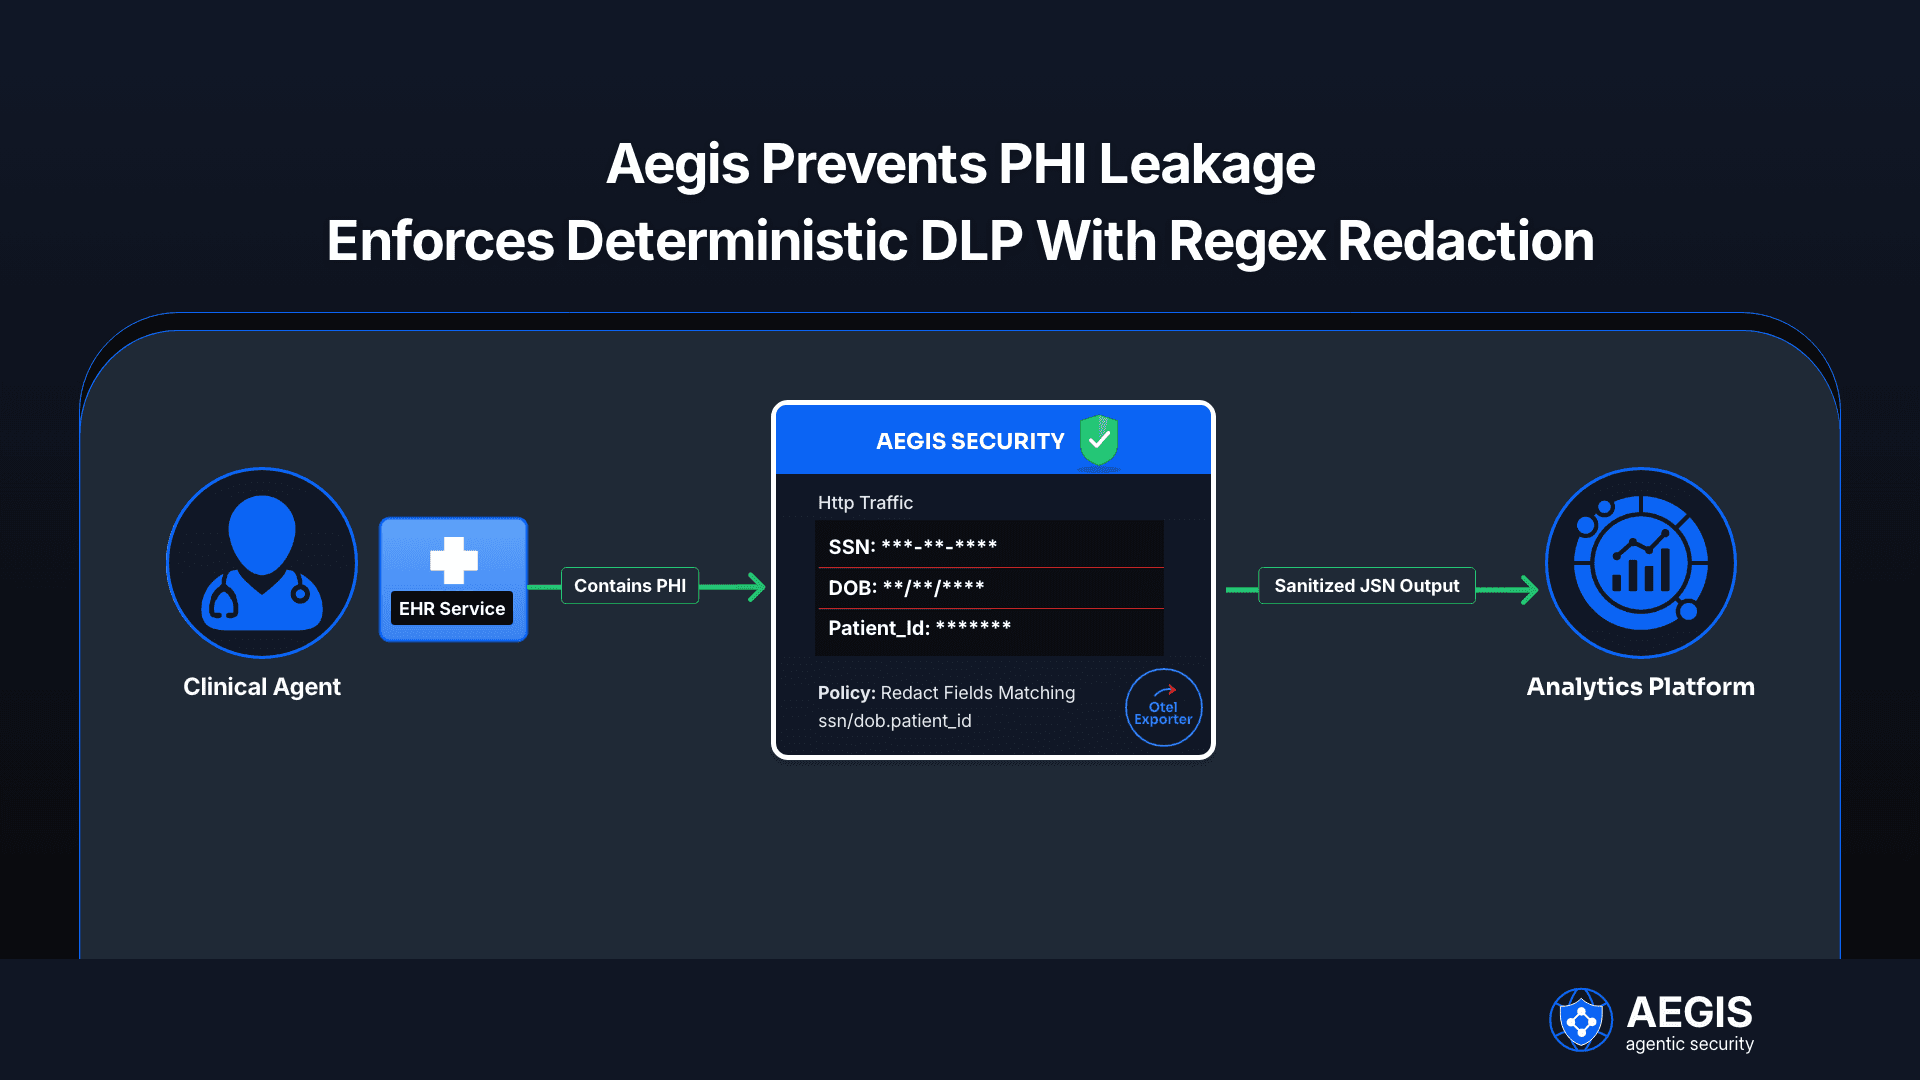
Aegis is designed as a runtime policy + telemetry fabric for multi-agent systems — a sidecar or forward proxy that evaluates policies, enforces allow/deny/sanitize/approval_needed outcomes, and emits OpenTelemetry spans for every agent→tool interaction. Below are concrete Aegis tests you should include in your regression and CI suites.
Aegis functional & performance test checklist
- Policy decision latency micro-benchmark
- Test: issue 10k synthetic authorisation requests against the Aegis decision server with prepared-query caches enabled and disabled.
- Measure: P50/P95/P99 decision latency for allow/deny/sanitize responses.
- Goal: P99 ≤ 20ms for common rules; overall proxy overhead <5–10ms.
- Chained orchestration throughput test
- Test: run 1k concurrent orchestrations with 3-agent chains routed through Aegis; include approval flows for 10% of requests.
- Measure: end-to-end P95 task time, number of approvals processed per second, and queue growth for pending approvals.
- Approval path resilience
- Test: simulate approval backend downtime; validate fail-closed semantics for write operations and fail-open optional for reads if configured.
- Measure: failed approval counts, timeouts, retry behavior, and alerting.
- Cost & budget enforcement
- Test: simulate expensive LLM responses (latency and cost) and verify per-agent daily budget enforcement and throttling.
- Measure: number of calls blocked by budget, billing metadata in telemetry.
- Shadow mode A/B regression
- Test: run policies in shadow mode for seven days, collect would-deny metrics, then flip to enforced mode; measure regression threshold (P95 not to increase >10% per release).
- Test: run policies in shadow mode for seven days, collect would-deny metrics, then flip to enforced mode; measure regression threshold (P95 not to increase >10% per release).
- Policy hot-reload & versioning
- Test: push new policy bundle while traffic runs; ensure no request loss and new decisions use the updated bundle.
- Measure: bundle propagation time, mismatched decision rates.
Aegis observability must surface policy hot paths and attribution. Example outcome: after profiling, a customer discovered 60% of latency on a critical path came from an unoptimized Rego rule — a common operational lesson where policy complexity maps directly to latency.
Interpreting results and prioritising fixes
When a test highlights regressions, triage using the following decision tree:
- Is the regression in policy eval? If yes, profile rules (prepared queries, refactoring Rego, use WASM).
- Is it network/proxy overhead? Tune keepalives, HTTP/2, connection pooling.
- Is it resource saturation? Add CPU, tune thread/goroutine pools, and run soak tests.
- Is the orchestration logic causing retries? Adjust retry policy and backoff parameters.
Use regression thresholds — e.g., no more than 10% increase in P95 per release — and gate CI pipelines on those thresholds.
Practical examples and comparison
A quick reference comparing legacy tests vs. modern multi-agent performance tests:
Dimension | Legacy single-endpoint test | Multi-agent Aegis-aware test |
Focus | Single latency or RPS | End-to-end orchestration P95/P99 + policy latency |
Tracing | Limited | OpenTelemetry correlated spans across agents/tools |
Policy | N/A or static | Runtime policy eval with approval workflows |
Failure modes | HTTP errors | Approval queue saturation, policy misconfiguration, budget exhaustion |
Tools | k6/JMeter | k6 + custom harness + Jaeger + Grafana + OPA profiling |
Implementation tips for CI/CD
- Run nightly full workflow stress tests in a staging environment with production-like data (sanitised traces replayed as inputs).
- Integrate performance gates on pull requests for policy changes; run prepared-query latency tests.
- Keep shadow mode for new or complex policies and require observed would-deny < threshold before enforcing.
Closing Notes
Agent performance testing must evolve from single-endpoint checks to holistic orchestration benchmarks that include policy evaluation, approval workflows, and cost simulations. Aegis combines runtime enforcement, telemetry, and policy lifecycle tooling to help teams measure, enforce, and iterate on safe, performant multi-agent deployments.
👉🏻 Ensure uptime with resilient architectures and redundancy strategies
Frequently Asked Questions
Q1: What is the single most important metric for agentic workflows?
A1: End-to-end P95 task time for critical orchestrations; it combines policy latency, network, and tool latency into a user-visible number.
Q2: How do I measure policy decision latency separately from network overhead?
A2: Instrument the policy evaluator to emit a dedicated "policy.eval" span with start/end timestamps; subtract proxy/transport spans to isolate eval time.
Q3: Should policies be tested in shadow mode?
A3: Yes — shadow mode for 7–14 days helps collect would-deny events and tune rules before enforcement.
Q4: What target should I aim for policy P99 latency?
A4: Aim for ≤ 20ms P99 for simple rules; complex rules may require refactoring or WASM compilation.
Q5: How can Aegis help with compliance and auditing?
A5: Aegis emits structured OpenTelemetry spans and signed audit logs containing agent_id, policy_version, decision and approval_id, enabling SOC and compliance reviews.
Q6: How do I handle approval fatigue when many requests require human checks?
A6: Use thresholds in policies to reduce low-risk approvals, batch approvals, and introduce automated allowlists for verified agents.